Pressure-Volume (PV) Diagrams are used to describe the pressure and volume relationship in a dynamic(changing) system. The area under the curve in a PV diagram describes the work done in the system.

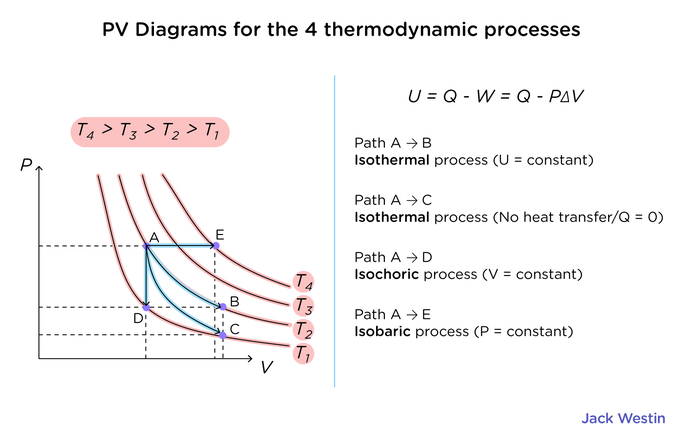
From the pressure vs. volume diagram above, it can be seen that the increase in volume results in a decrease in pressure. An important piece of data that can be taken from this diagram is the amount of work done by the system. This value can be taken by taking the integral of the function between V1 and V2. In other words, the area under the curve can be calculated to find the amount of work done. From this graph, we can derive that if the final volume is greater than the initial volume, more work is done; the max work that can be done in a system in regard to pressure and volume is a system that can have reversible gas expansion.
Practice Questions
Khan Academy
MCAT Official Prep (AAMC)
Official Guide C/P Section Question 27
Key Points
• The work done by a system can be calculated by the area under a curve in a pressure-volume diagram.
• A reversible process can produce the greatest amount of work.
Key Terms
work: form of energy transfer in a system
reversible: process where the system can be returned to its original state